> ## Documentation Index
> Fetch the complete documentation index at: https://www.voiceflow.com/docs/llms.txt
> Use this file to discover all available pages before exploring further.
# Analytics
> Track your Voiceflow agent's performance, usage, costs, and evaluation results with a customizable analytics dashboard and drill-down views.
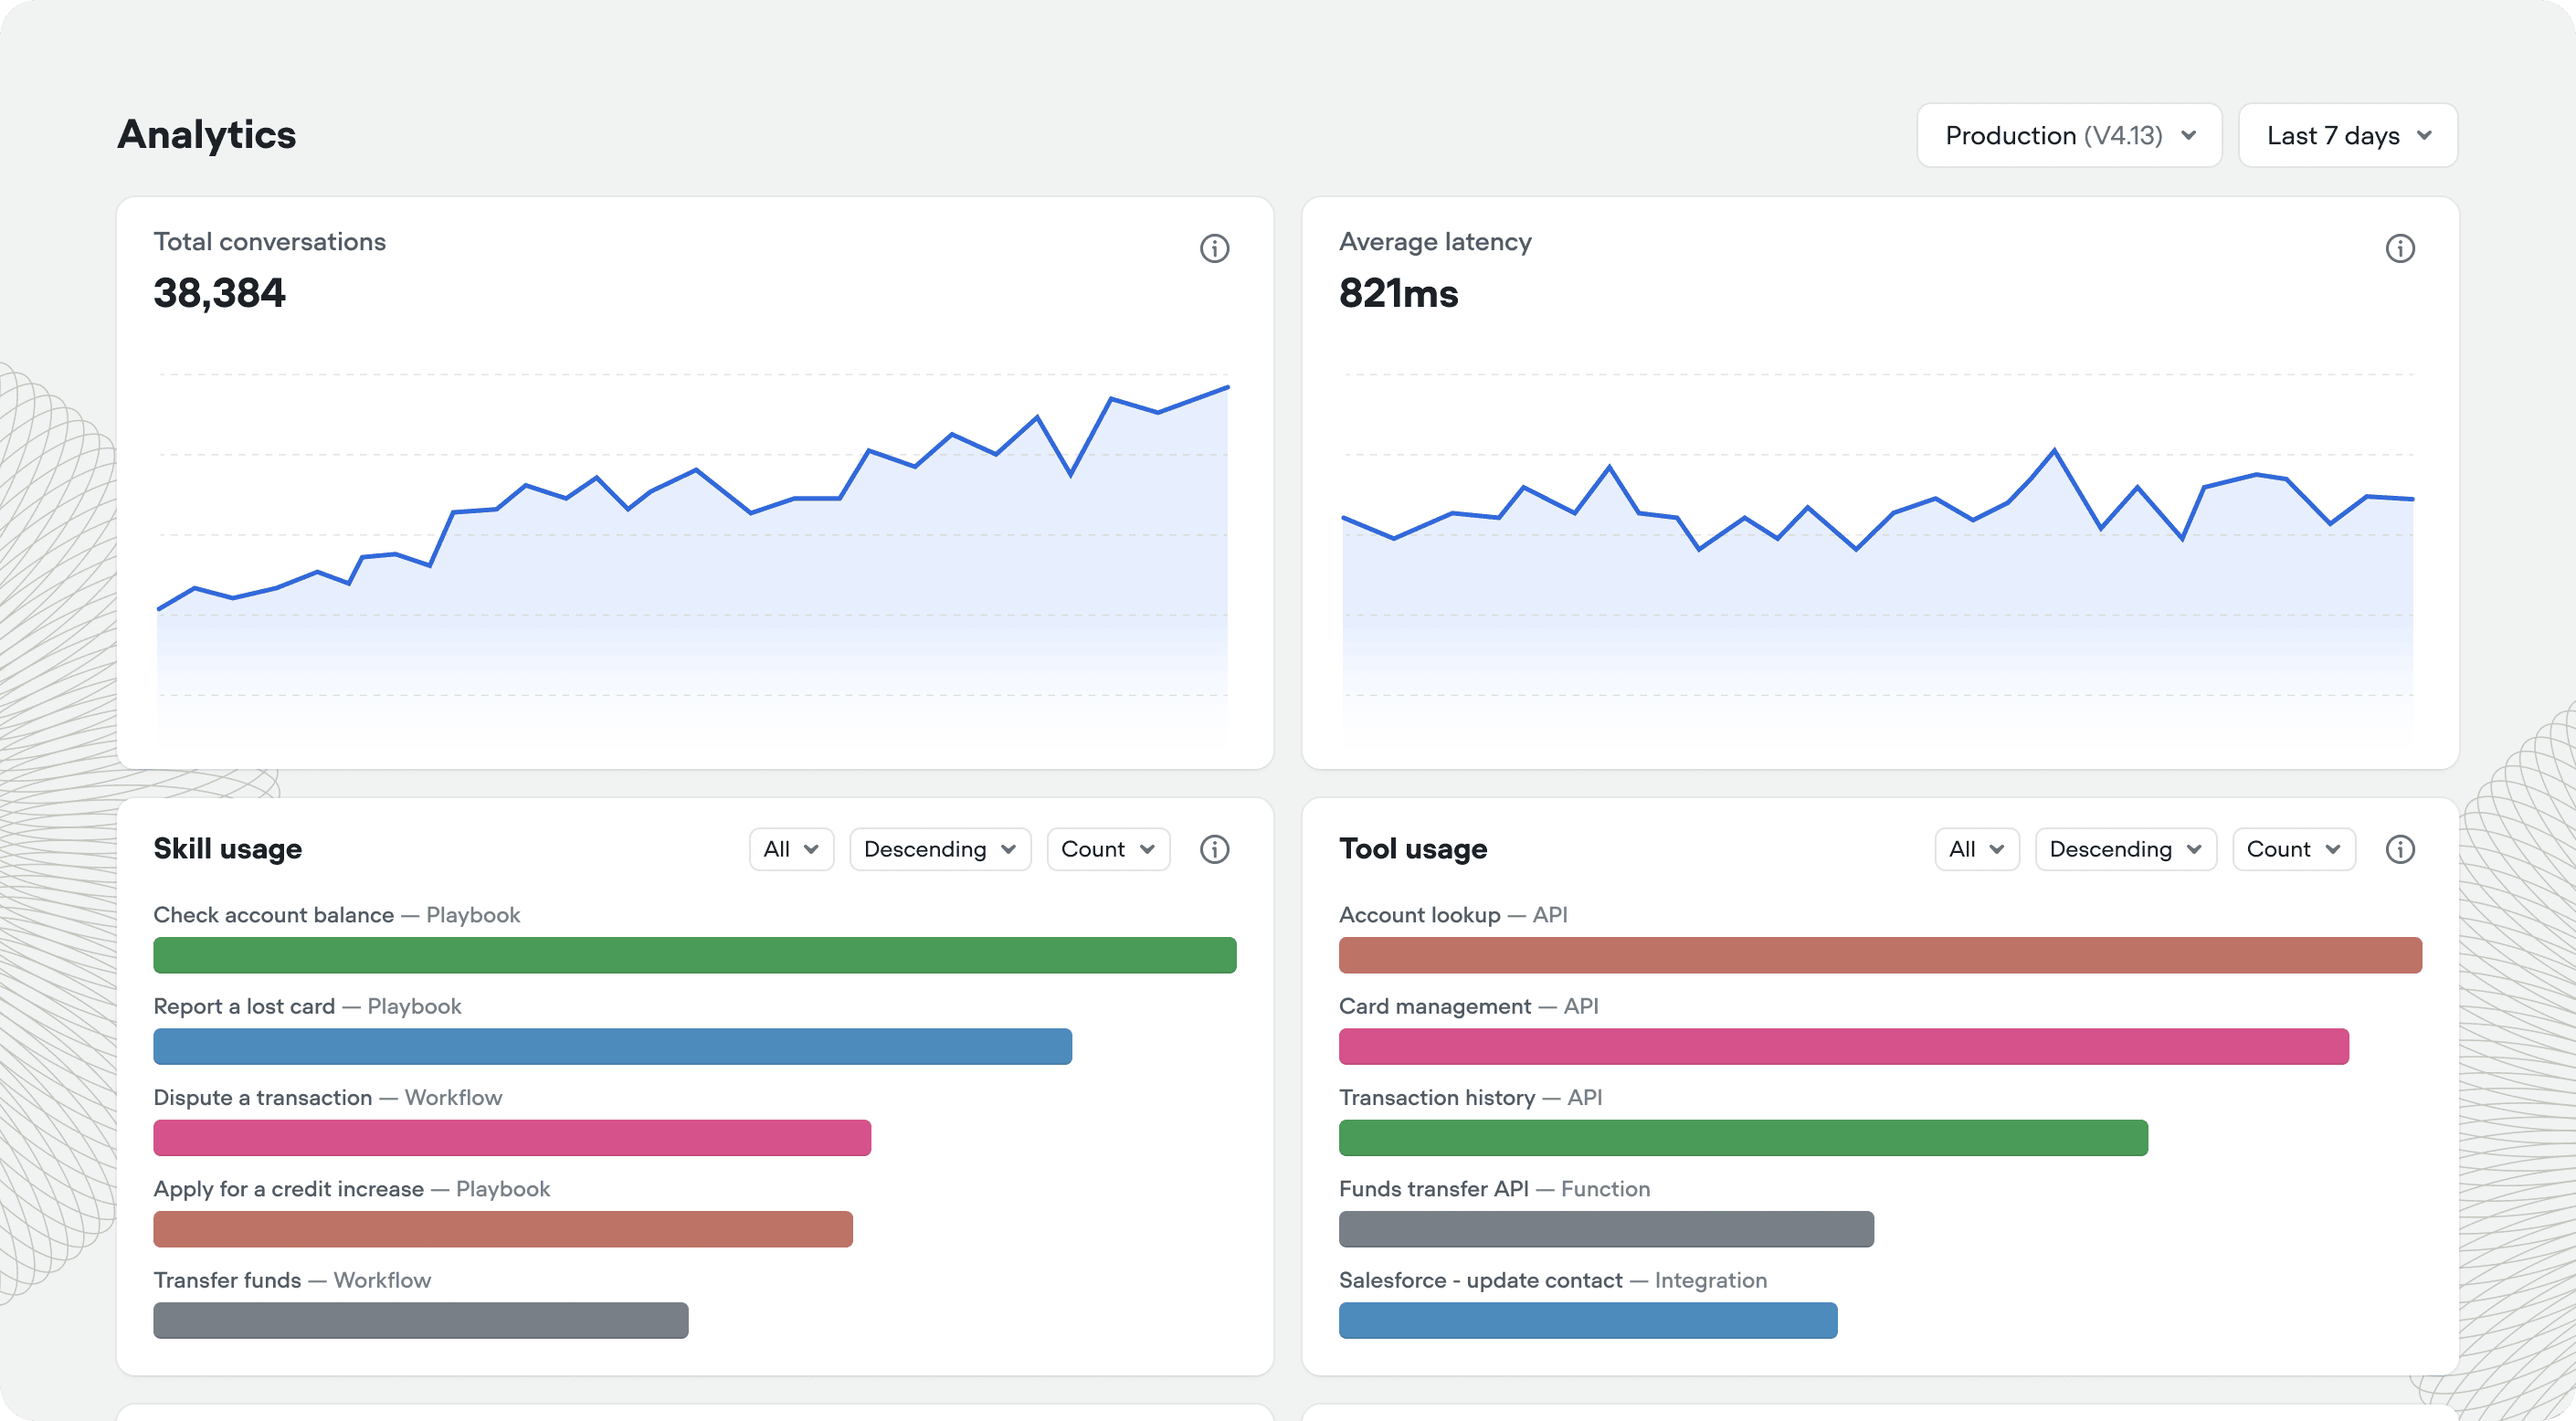 The Analytics dashboard gives you a high-level view of how your agent is performing across production conversations. You can monitor evaluation results, usage patterns, costs, and operational metrics all in one place. Access the dashboard from the **Analytics** tab in the sidebar.
## Filtering your view
Use the controls at the top right to filter the data displayed across all widgets. The **Environment** dropdown lets you view metrics across all [environments](/docs/documentation/deploy/environments) in the project or focus on a specific one. The **Date range** picker controls the time period for all charts and metrics.
## Customizing the dashboard
Click the settings icon to choose which widgets appear on your dashboard. Which widgets are available depends on whether your agent runs on chat or voice:
* **Both**: Resolved conversations, Unique users, Avg. latency, Credits usage, Cost breakdown, LLM cost, Avg. cost per conversation, Playbooks usage, Workflow usage, Tools usage, KB documents usage, and a card for each enabled [evaluation](/docs/documentation/measure/evaluations)
* **Chat only**: Total chats and Total messages
* **Voice only**: Total calls, Total call minutes, TTS cost, and STT cost
Click **Reset to default** to restore the standard widget configuration. Hover over any metric's info icon for more detail about what it measures.
## Trends
The summary cards at the top of the dashboard show how each metric has moved against the preceding period of the same length, so a seven-day range is measured against the seven days before it. Change the date range and both periods shift with it.
The Analytics dashboard gives you a high-level view of how your agent is performing across production conversations. You can monitor evaluation results, usage patterns, costs, and operational metrics all in one place. Access the dashboard from the **Analytics** tab in the sidebar.
## Filtering your view
Use the controls at the top right to filter the data displayed across all widgets. The **Environment** dropdown lets you view metrics across all [environments](/docs/documentation/deploy/environments) in the project or focus on a specific one. The **Date range** picker controls the time period for all charts and metrics.
## Customizing the dashboard
Click the settings icon to choose which widgets appear on your dashboard. Which widgets are available depends on whether your agent runs on chat or voice:
* **Both**: Resolved conversations, Unique users, Avg. latency, Credits usage, Cost breakdown, LLM cost, Avg. cost per conversation, Playbooks usage, Workflow usage, Tools usage, KB documents usage, and a card for each enabled [evaluation](/docs/documentation/measure/evaluations)
* **Chat only**: Total chats and Total messages
* **Voice only**: Total calls, Total call minutes, TTS cost, and STT cost
Click **Reset to default** to restore the standard widget configuration. Hover over any metric's info icon for more detail about what it measures.
## Trends
The summary cards at the top of the dashboard show how each metric has moved against the preceding period of the same length, so a seven-day range is measured against the seven days before it. Change the date range and both periods shift with it.
 ## Drilling into evaluation results
The Resolution and Customer satisfaction charts break conversations down by outcome. Resolution outcomes are Resolved, Ticket created, Unresolved, Abandoned, and Unrelated; see [Resolution categories](/docs/documentation/measure/evaluations#resolution-categories) for what each one means.
Click **View** on either chart to open a detailed drill-down. From there you can filter by date and time, environment, user ID, cost, duration, result, browser, OS, device, country, property, playbook, workflow, or tool. The drill-down shows total logs and average cost alongside a table of individual conversations with their timestamp, cost, and result. The **Prompt** tab shows the exact evaluation criteria used to classify each conversation.
Click any conversation in the table to see its evaluation log, and open the full transcript to review what happened turn by turn.
## Estimating business impact
The **Time saved** and **Dollars saved** widgets help you quantify the value your agent provides. Click **Add estimate** to configure how much time or money each automated conversation saves compared to manual handling. Once configured, the dashboard calculates your total savings based on conversation volume.
## Drilling into evaluation results
The Resolution and Customer satisfaction charts break conversations down by outcome. Resolution outcomes are Resolved, Ticket created, Unresolved, Abandoned, and Unrelated; see [Resolution categories](/docs/documentation/measure/evaluations#resolution-categories) for what each one means.
Click **View** on either chart to open a detailed drill-down. From there you can filter by date and time, environment, user ID, cost, duration, result, browser, OS, device, country, property, playbook, workflow, or tool. The drill-down shows total logs and average cost alongside a table of individual conversations with their timestamp, cost, and result. The **Prompt** tab shows the exact evaluation criteria used to classify each conversation.
Click any conversation in the table to see its evaluation log, and open the full transcript to review what happened turn by turn.
## Estimating business impact
The **Time saved** and **Dollars saved** widgets help you quantify the value your agent provides. Click **Add estimate** to configure how much time or money each automated conversation saves compared to manual handling. Once configured, the dashboard calculates your total savings based on conversation volume.