Chatbot Analytics 2025: How AI-Driven Insights Supercharge Results

Discover top analytics tools and tactics to turn your AI chatbot data into ROI with real-time Chatbot Analytics insights. Read the 5-minute guide now.
Chatbots
Article Main Image

If you're reading this, chances are you're already running a chatbot or seriously considering it. Whether you're improving customer support or streamlining everyday communication, one thing is clear: your chatbot's effectiveness heavily relies on chatbot analytics.

Effective analytics will really transform the way you build and deploy chatbots. From my experience running the AI agency Dalai, I've seen firsthand how analytics help businesses measure, understand, and continuously refine their chatbot's performance. This allows you to pinpoint exactly where improvements are needed, plus, consistently tracking your chatbot's impact makes demonstrating things like ROI straightforward.

In this guide, we'll explore:

  • Why chatbot analytics matter
  • Step-by-step guidance to measure performance
  • Essential metrics to track
  • Advanced analytical techniques with real-world examples
  • How to choose the right analytics platform
  • Practical implementation tips

Why Chatbot Analytics Matter

Deploying a chatbot without analytics is like navigating the sea without a compass. Here’s why analytics matter:

  • Proving ROI: Show your chatbot’s business value through measurable time and cost savings.
  • Optimizing Performance: Understand what’s working and what needs improvement.
  • Detecting Issues Early: Catch and fix issues before they affect users.

Step-by-Step Guide to Measuring Performance

Setting up chatbot analytics isn't just about collecting data. It's about turning that data into insights you can act on. Here's how:

1. Define Clear Metrics and KPIs to Track

Your chatbot’s purpose drives what you measure. Ask yourself: are we trying to reduce human workload, improve answer quality, or justify investment? Once you’ve got clarity, choose metrics like:

  • Fallback rates
  • Escalation counts
  • Successful answers
  • User feedback
  • Cost savings

2. Set Up Effective Data Collection

Platforms like Voiceflow or Intercom provide basics like message count, conversations, and user numbers from the API. But if you want deeper insight, you need to go further.

Here’s how I do it at Dalai:

  1. Add Feedback Prompts
    You can use a button-step after AI responses to get user feedback
  2. Use AI Classification
    Add an AI step that classifies if the query was truly resolved. This gives you a clean success/failure metric.
  3. Manually Log Escalations
    Trigger an API call when a human takes over.
  4. Track These Metrics with an API Block
    I use API blocks to send custom event data to an external database. This gives me total control over what I track.
    My go-to tool? Airtable. It’s super intuitive, requires no code, and makes it easy to structure and store data like:
    • Chatbot ID
    • Timestamp
    • Intent name
    • User query
    • Outcome (success or fallback)
    • Feedback

Note: Not all data has to be logged in an external database. Most AI chatbot platforms let you fetch standard metrics from the API. For Voiceflow I use the API to fetch amount of conversations and messages as well as categories(based of intents).

3. Regularly Review, Analyze, and Adjust

This isn’t a one-time setup. I recommend that you review metrics at least monthly. Look for patterns in fallbacks, drops in engagement, or strange behavior.

Ask why things happened, then fix them. Data is only valuable if you use it to improve.

Key Chatbot Metrics to Track Chatbot Performance

Tracking the right metrics is where the real magic happens. Over the past years working with clients, I’ve learned that generic analytics dashboards often use the wrong metrics. To get truly actionable insights, you need to go deeper and focus on the right level of granularity.

Here’s what I always look at:

Usage Metrics

  • Total Messages: Great for estimating usage and cost, but this can be inflated if some users repeat questions so there would be natural spikes
  • Total Conversations: Gives a clearer view of actual sessions. One session = one conversation, regardless of how many messages. Can still be inflated by users starting lots of sessions
  • Unique Users: Shows how many distinct users interacted with your bot in a given time period. The most stable metric of the 3 usage metrics. However the number game is not that impressive with this metric. I don't recommend basing investment related things like ROI with this metric as you would be missing out on sessions as most of users have multiple conversation sessions

Quality and Performance Metrics

  • Successful Answers vs. Fallbacks: This ratio helps assess the bot’s performance. A high fallback rate often points to a weak knowledge base. Be careful though, just because the AI successfully answered, does not mean the response was great.
  • Escalated Conversations: Indicates how many chats require human help. Low numbers are good, but context matters depending on your use case. If your goal is for the AI to tackle as many questions as possible, and reduce tickets, it's important that you track escalated conversations to see how well your chatbot is actually doing this.
  • User Feedback: Whether it's thumbs, stars, or quick questions like “Was this helpful?”, even a small amount of feedback is enough to highlight trends. I recommend tying feedback directly to the question or intent it followed, so you know exactly what needs work.

💡 Tip: I also like to follow up with users when they respond positively. Something like, “Glad that helped! Can you share what made it useful?” This small interaction often yields big insights.

Topic and Intent Metrics

  • Frequently Asked Topics: Your top intents show you where users spend most of their time. That tells you what to optimize or expand next so that you can improve your chatbot in the places that gets used the most.

ROI Metrics

  • Time and Money Saved: This is the one metric chatbot owners care about most. I calculate it like this:
    • If a chatbot saves 2 minutes per conversation…
    • And a human agent earns $40/hour…
    • Then every 30 conversations handled by the chatbot saves $40. The trick is personalization. Don’t use generic formulas. Let the user of the Analytics dashboard put in their hourly wage and the time they usually spend on handling conversations without the AI. That makes your monthly reports feel real and trustworthy. You can also set up advanced calculations using the other metrics shown above. What I do for my chatbots is also count conversations that were not handled properly and subtract that from the total amount saved. That leads to the most accurate results.

Using Advanced Analytics: Real-World Insights

Here’s a real example from one of my chatbots that shows why you can't just rely on surface-level metrics:

We had just rolled out what we thought was a simple update to one of our client’s chatbot. Within hours, I noticed something that, at first glance, looked like great news: a huge spike in successful answers. It was the kind of graph you love to see. But something about it didn’t sit right with me. The jump was just too sudden, too clean.

So I dug deeper. I compared the spike to the time of the update I had just rolled out and saw a perfect overlap. That made me suspicious. I started going through individual conversation logs, and what I found was concerning: the AI classifier that was supposed to decide whether the chatbot had successfully answered the user's question was malfunctioning. It was marking everything as a success, even when the user clearly didn’t get the help they needed.

In reality, the chatbot was failing more often than usual, not less. It was hallucinating to the user when it actually should have sent a fallback response. But if I had relied on the success metric alone, I would’ve completely missed it. Worse, I might have reported to the client that things were going better than ever. It was the trend graph, combined with curiosity and manual review, that saved us from weeks of user frustration and poor experiences.

What I took from this: don’t assume that a metric going up is automatically good. You have to ask, why is this number changing? How is it calculated? And does it actually reflect what users are experiencing?

Visualizing Your Chatbot Data: Picking the Right Charts

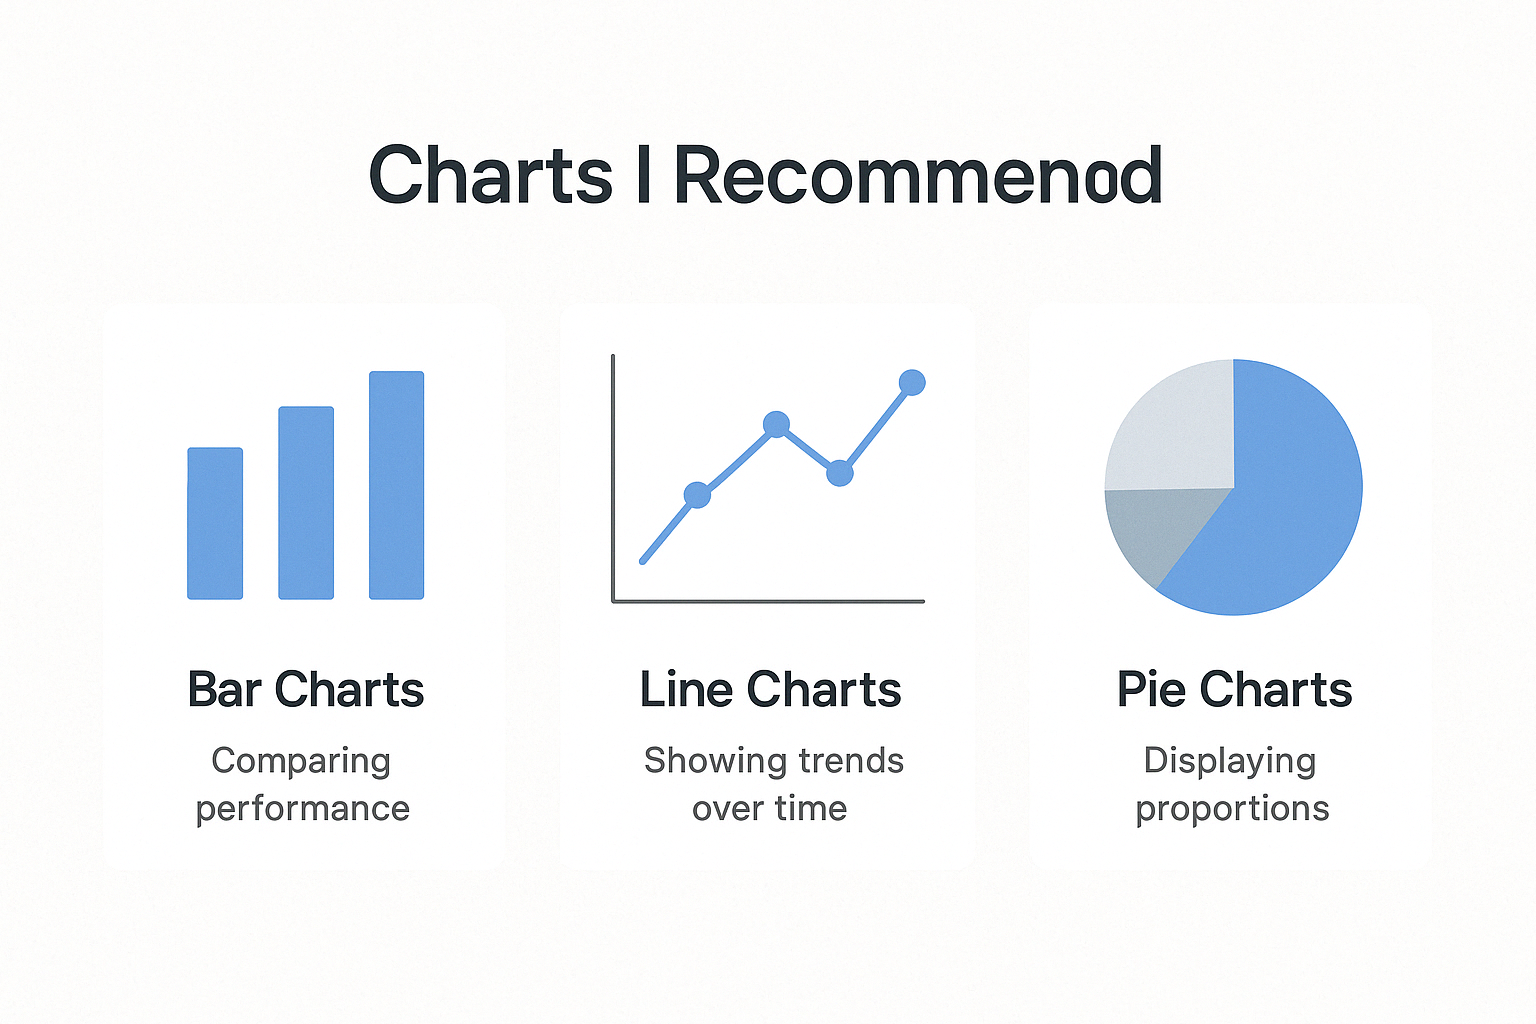
Now that you’ve got the metrics, how do you actually present them in a way people understand? Visualization is everything. The wrong chart can confuse your team or your client. The right one can make your insight click in a second.

Here's a breakdown of the chart types I regularly use, when to use them, and what to avoid:

Charts I Recommend

  • Bar Charts: Perfect for comparing performance across categories, like the number of successful answers vs. fallbacks. They’re clean, simple, and instantly understandable.
  • Line Charts: Great for tracking trends over time. I use these when I want to show how fallbacks are improving month over month, or how user volume changes throughout the week. Just make sure to label your time intervals clearly.
  • Pie Charts (Used Sparingly): These are okay when you want to show a simple proportion, like what percent of conversations were successful. But if you have more than 3-4 slices, it quickly becomes hard to read
  • Simple numbers: In addition to showing visual charts, it's always a good idea to show all metrics as simple numbers.

Common Pitfalls to Avoid

  • Overcomplicating Visuals: Don’t use complex 3D charts or heavy color gradients. They might look cool, but they often confuse more than they help.
  • Too Much Data at Once: If you try to show 15 metrics on one chart, nobody will understand it. Keep it focused and clear.
  • Misleading Axes: Always start your y-axis at 0 unless you have a good reason. Otherwise, even small changes will look dramatic and can be misinterpreted.
  • Forgetting Labels and Units: You’d be surprised how often this happens. Always label your axes, include units (minutes, percentages, etc.), and show the time range.
  • Ignoring the Audience: A chart for your development team will look different than one you send to a marketing manager. Tailor the visuals based on who’s reading it.

My Go-To Setup

For most client dashboards, I like to use:

  • Line charts for performance over time
  • Bar charts for intent and usage comparisons
  • Pie chart for success vs. fallback overview, and thumbs up vs thumbs down. Then you can also show messages that were not reviewed. Example 90%were not reviewed, and 5% were thumbs up, and 5% were thumbs down
  • Simple numbers I use simple numbers for all metrics. I usually put these at the top

That simple combo works in 90% of real-world cases. Keep it clean, explain what they’re looking at, and use visuals to guide smart decisions.

What to Look For in an Analytics Platform

Picking the right platform makes a big difference. Here’s what I look for:

  • Visual Reports: You should be able to understand performance at a glance.
  • Transparency: Know exactly how your metrics are calculated.
  • Custom Tracking: Every team has different goals. Your platform should let you track what you care about.
  • Live Data: Seeing what’s happening right now lets you catch problems early.
  • Integrations: Make sure it works well with tools you already use

Practical Tips for Implementation

Here are a few things I always keep in mind:

  • Avoid evaluating chatbot performance based on a single number. Metrics without context can mislead, so always analyze them in relation to your chatbot’s overall goals.
  • Review fallback logs regularly. They can help you identify what's going wrong.
  • Tie metrics back to business value. That’s how you keep stakeholders on board.
  • Mix feedback and performance. You need both to get the full picture. Just because the chatbot technically responded successfully doesn’t mean the user felt satisfied with the outcome. Always dig into feedback to understand the full picture.

One Final Tip

Send a short analytics summary every month to your team or client. Include usage numbers, fallback trends, top questions, and estimated ROI. It keeps everyone in the loop and reminds them the chatbot is doing real work.

Conclusion

Here’s the bottom line: analytics aren’t just something you bolt on after launching a chatbot. They’re a core part of making your chatbot smarter, more helpful, and ultimately more valuable to your business.

You should not just just review numbers, you should ask why those numbers matter, what they say about the user experience, and what needs to change.

So if you’re running a chatbot today, here’s what I’d recommend:

  • Track what matters, not what’s easiest to measure
  • Visualize your insights in a way that makes sense to real people
  • Focus on trends, not just the numbers
  • Treat fallbacks and escalation logs as your best teachers
  • Send regular updates to keep stakeholders engaged
  • Set up custom metrics for your chatbot

And that wraps up chatbot analytics in 2025.

Contributor
Verify logo
Content reviewed by Voiceflow
AI Agency Owner @ Dalai
I’m an owner at Dalai and a regular contributor to the Voiceflow blog. Resourceful and comfortable juggling multiple projects at once, I’m always hunting for fresh challenges and innovations that push our products forward. I also enjoy serving as a mentor and point of inspiration for the rest of the development team.
Build, test, and track your AI chatbot in Voiceflow—complete with built-in analytics and one-click integrations.
Get started, it’s free
Build, test, and track your AI chatbot in Voiceflow—complete with built-in analytics and one-click integrations.
Get started, it’s free
This is some text inside of a div block.

Start building AI Agents

Want to explore how Voiceflow can be a valuable resource for you? Let's talk.

ghraphic