
Monitoring your credit usage


As you test and deploy your agent, we recommend periodically reviewing its analytics. You can find these by opening the project on the Voiceflow dashboard, then clicking the Analytics icon on the sidebar of the Voiceflow CMS.

The dashboard contains a bunch of useful stats, but the most important one to consider when optimizing your agent is the Credits usage chart.
The credits usage chart
The credits usage chart lets you see how your credits are being consumed on a daily basis. The chart will break down feature usage (for example, Twilio voice) and the models you’re using (like Claude 3.5, or GPT-4o).
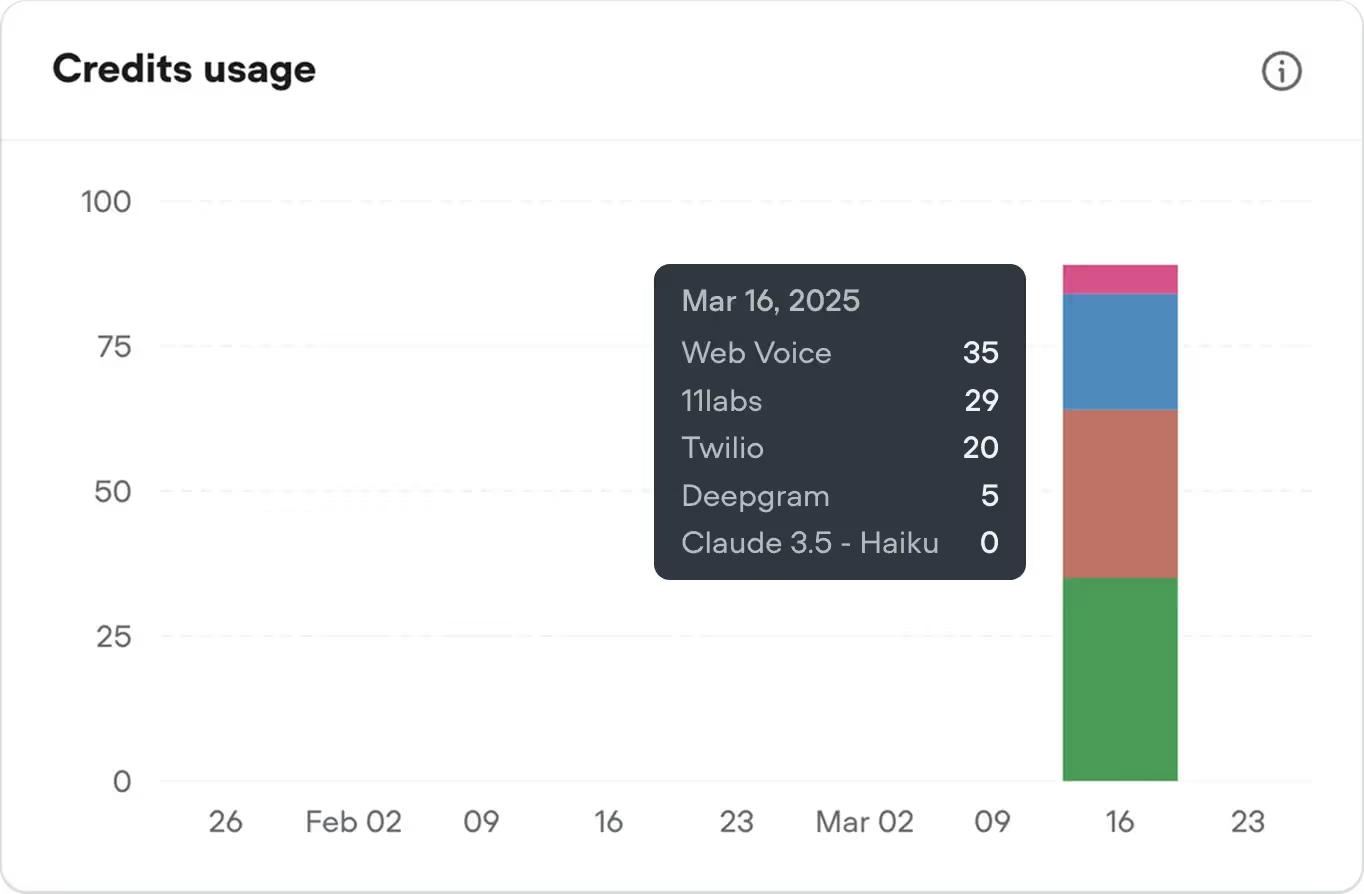
By taking a look at these stats, you can understand where the bulk of your credit usage is happening. This will help inform where to focus when optimizing your agent.
One important thing to note: one model using significantly more credits than another doesn’t automatically mean your agent is unoptimized. For example, if your agent is using both GPT-4o and GPT-4o mini for the same number of similar prompts, we’d expect to see GPT-4o using many more credits than GPT-4o mini. This is because GPT-4o usage has a 2.5x multiplier applied to it, whereas GPT-4o mini has a 0.08x multiplier. GPT-4o mini is a more cost effective model, so it uses fewer credits.
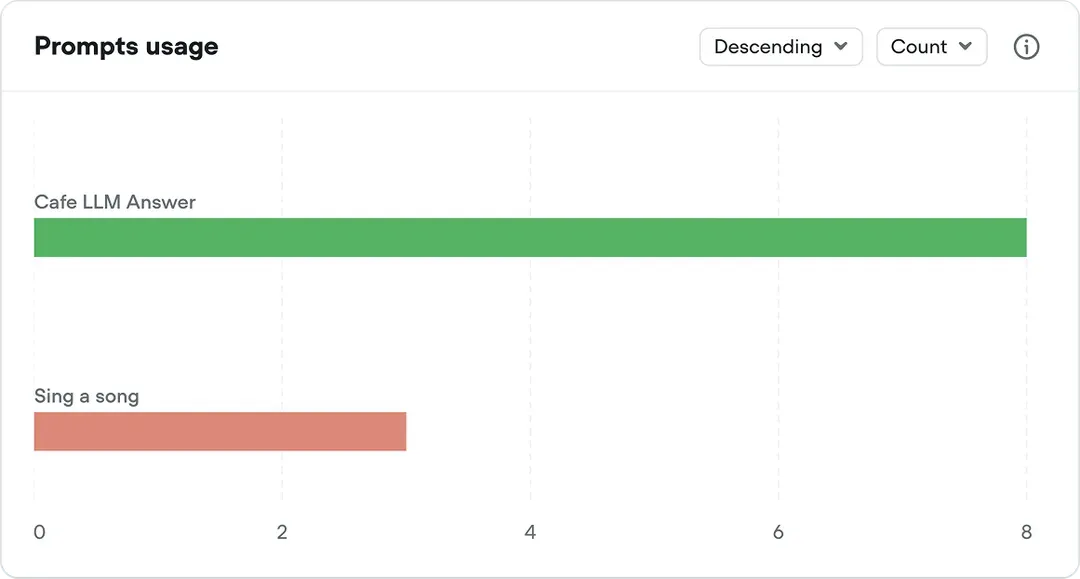
The prompts usage chart
Another great chart to look at is the Prompts usage chart. This lets you see which prompts are used most by your agent. You should prioritize optimizing prompts which are used most often, as these are likely to have the highest impact on your credit usage.
Resources

Build AI Agents for customer support and beyond
Ready to explore how Voiceflow can help your team? Let’s talk.